
Machine monitoring provides you with a direct, fact-based overview of the performance of each individual plant component in real time. Plant managers, engineers, and OT/IT teams use it to identify downtime more quickly, plan maintenance work in a targeted manner, and keep production processes stable.
Machine Monitoring: Key takeaways
- Machine monitoring provides real-time visibility into machine states, cycle performance, and process deviations across entire production lines.
- A machine monitoring system stays reliable at scale when it is built on MQTT’s publish/subscribe model, structured topic naming, and a consistent, decoupled data flow.
- Protocol mechanics matter: MQTT’s report-by-exception, Last Will and Testament (LWT), Sparkplug B, Quality of Service (QoS), and retained messages solve concrete manufacturing pains that generic polling cannot.
- Advanced use cases such as predictive maintenance, anomaly detection, and digital twins require accurate and continuous machine monitoring data.
- Cedalo offers an industrial-grade MQTT platform that strengthens machine monitoring through high availability, secure communication, and unified multi-site management.
What is machine monitoring?
Machine monitoring refers to the continuous capture and evaluation of machine data that reflects states, cycles, load levels, and deviations. Teams use this information to reduce downtime, plan maintenance with greater accuracy, and keep production targets on track.
How does machine monitoring fit into the OT/IT stack?
Machine monitoring complements SCADA and MES without replacing them. It provides the technical layer that structures OT signals, keeps them available in real time, and prepares them for planning, analytics, and operational decision-making.
The bigger question is how those signals move between systems. Traditional industrial integrations rely on rigid, point-to-point polling: an MES continuously asks each PLC “what is your current value?”, a historian polls the same PLC again, and every new consumer adds another direct connection. This couples systems tightly, multiplies load on the controllers, and turns every integration into custom work.
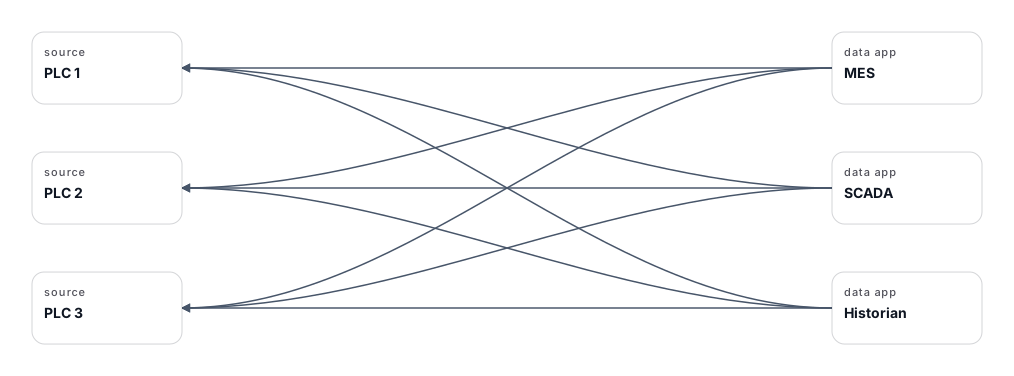
Figure 1: Traditional point-to-point polling wires every consumer directly to every machine. Each new system adds another connection to each PLC, multiplying load on the controllers and turning every integration into custom work.
MQTT’s publish/subscribe model breaks that pattern. A machine publishes each value once to a broker, and any authorized IT or OT system - MES, SCADA, analytics, a data lake, or a dashboard - subscribes and receives it instantly. Producers and consumers never talk to each other directly, so you can add or remove systems without touching the field devices.
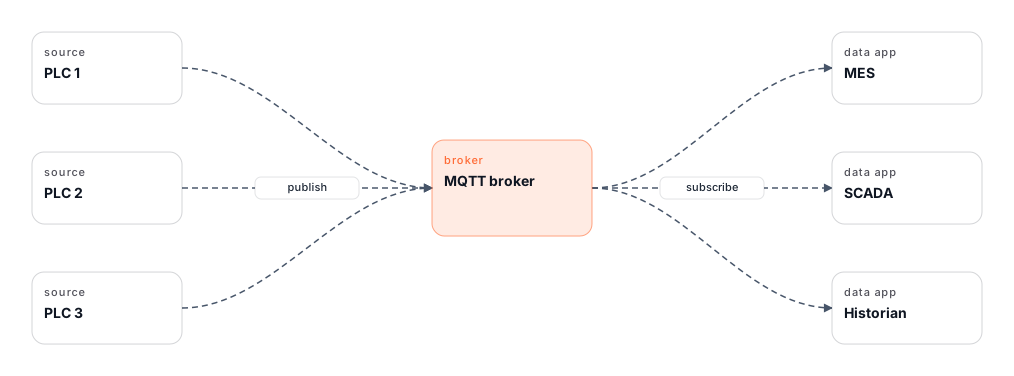
Figure 2: With MQTT’s publish/subscribe model, each machine publishes its data once to the broker and any system - MES, SCADA, or a Historian - subscribes to what it needs. Producers and consumers stay fully decoupled, so you can add or remove systems without touching the field devices.
Get reliable machine data for your entire operation
Cedalo helps you run stable brokers, manage clusters, and connect OT and cloud systems without friction.
What core requirements define a capable machine monitoring system?
A machine monitoring system needs a stable technical foundation that handles high data volume, reliable connectivity, and secure communication. The setup must collect signals in real time, forward them without interruption, and give teams a consistent view of machine behavior across the plant.
How does machine monitoring data flow operate in industrial environments?
Machine monitoring depends on a clean and predictable data path that moves signals from machines to the systems where teams evaluate performance and react to issues. A stable flow shortens diagnostic cycles, improves transparency, and supports precise analysis across the entire plant.
Why does MQTT sit at the center of the machine monitoring data path?
MQTT works well in industrial environments because it handles low-latency communication, steady delivery through QoS levels, and long-running connections over unreliable networks. The broker acts as the central hub where machine signals become accessible for every downstream system - published once, consumed many times.
How do clean MQTT topic structures support machine monitoring?
Clear topic naming keeps machines, lines, and locations easy to identify. A structured model simplifies diagnostics, streamlines reporting, and avoids uncontrolled data growth. Many teams rely on Unified Namespace concepts to keep large plants organized as deployments expand.
What production benefits can machine monitoring deliver?
Machine monitoring creates a consistent data layer that helps teams stabilize output, cut downtime, and improve planning accuracy across entire plants.
How does machine monitoring reduce unplanned downtime?
Unplanned downtime often starts with small, unnoticed changes: rising cycle times, fluctuating torque, unusual vibration, or longer warm-up phases.
Machine monitoring helps by:
- Highlighting slow shifts in machine behavior
- Showing repeated faults on specific stations
- Tracking overload patterns across shifts
- Providing clear data for root-cause analysis
But there is a subtler failure mode: a monitoring gap. When an edge gateway or a machine connection drops silently, dashboards keep showing the last value and teams react too late. MQTT solves this at the protocol level with Last Will and Testament (LWT): each client registers a “last will” message when it connects, and the broker publishes it automatically the moment that client disconnects unexpectedly.
Sparkplug B builds on LWT to standardize state management for industrial deployments. Every device announces a Birth certificate when it comes online and is guaranteed a Death certificate (via LWT) when it goes offline. The entire system is notified within milliseconds when an edge gateway drops - so you catch a monitoring blind spot before a line stalls, instead of discovering the data gap afterward.

Figure 3: With Sparkplug B, every device publishes a Birth certificate on connect and is guaranteed a Death certificate through MQTT’s Last Will and Testament - so a dropped edge gateway is detected immediately, not after the data gap causes a stall.
How does machine monitoring support accurate OEE calculations?
Overall Equipment Effectiveness (OEE) depends on reliable information about availability, performance, and quality. Manual tracking often leads to blind spots.
Machine monitoring provides:
- Precise runtime and stop-time measurements
- Actual cycle times instead of estimates
- Automatic tagging of micro-stops and interruptions
- Quality-related signals that feed into performance analysis
The reason MQTT captures these values so efficiently is report-by-exception (publish on change). Traditional protocols choke factory bandwidth because they constantly poll machines - asking “are you running?” every 100 ms whether anything changed or not. MQTT only sends data when a state changes or a threshold is crossed, so a fast micro-stop is captured as a discrete event the instant it happens, without flooding the network with redundant readings. That makes OEE figures both more accurate and far cheaper to collect at scale.
How does machine monitoring improve production planning?
Planning relies on realistic output and resource expectations.
Machine monitoring helps planners and supervisors with:
- Real cycle-time distributions, not theoretical ones
- Updated performance benchmarks for each product variant
- Load profiles over days and weeks
- Clear insights into changeover duration and impact
How does machine monitoring contribute to energy and material efficiency?
Many plants want to reduce energy waste and scrap.
Machine monitoring supports that by:
- Showing idle consumption of machines and auxiliaries
- Highlighting energy peaks tied to specific operations
- Tracking reject rates alongside machine states
- Providing data to tune process parameters more precisely
How does machine monitoring perform in high-demand production environments?
High-demand plants push machines, lines, and teams close to their limits. A robust machine monitoring system helps you keep throughput high, protect takt times, and shorten fault analysis when every minute counts.
How does machine monitoring support high-throughput production lines?
In automotive, packaging, and electronics assembly, short cycle times leave little room for manual checks. With machine monitoring in place, you track:
- Line speed and takt time per station
- Micro-stops and short interruptions
- Changeover duration and ramp-up phases
- Blocked and starved states between machines
This is exactly where MQTT’s report-by-exception model pays off. On a high-throughput line, polling every asset on a fixed interval either misses sub-second micro-stops or saturates the network. Publishing only on change captures those fast-moving events precisely while keeping bandwidth free for the rest of the plant.
Machine monitoring gives shift leads and process engineers a shared, real-time view of where capacity drops first. That view guides decisions on staffing, sequencing, and setpoint adjustments.
What does machine monitoring add to regulated or critical processes?
In food, pharma, or chemical production, process windows are narrow and quality risks are high. Machine monitoring supports these environments with:
- Continuous tracking of critical parameters such as temperature, pressure, and flow
- Recorded equipment states for audits and customer documentation
- Alerting on drift before a batch leaves the tolerance band
In regulated industries, a missing data point can mean a failed audit - so guaranteed delivery matters. MQTT’s Quality of Service (QoS) levels provide it: QoS 1 guarantees a message is delivered at least once, and QoS 2 guarantees exactly-once delivery for the most critical parameters. Retained messages complement this by storing the last known good value on each topic, so any application that connects - a new dashboard, an audit tool, or a recovered gateway - instantly receives the current plant state instead of waiting for the next update. Combined with a secure MQTT backbone and proper audit trails, this strengthens compliance and shortens investigations after incidents.
Strengthen your machine monitoring setup
Get a stable MQTT backbone for high-demand production lines. Work with Cedalo to stabilize data flow, manage clusters, and connect OT and cloud systems at scale.
Which machine monitoring metrics create real operational insight?
Machine monitoring generates large volumes of signals, but only a defined set of metrics drives real operational decisions. These metrics help engineers track machine health, stabilize takt times, and guide improvement work across shifts.
Which machine state metrics matter most in daily operations?
- Runtime: Shows how long a machine actively produces.
- Stop time: Identifies interruptions that cut into throughput.
- Micro-stops: Reveal short disturbances that operators often miss.
- Mode changes: Track transitions such as auto, manual, setup, or maintenance.
These values allow teams to see patterns behind repeat disruptions and support more targeted interventions.
Which performance metrics improve takt stability and throughput?
- Cycle time per unit: Core indicator for line speed.
- Variation in cycle time: Signals drift, tool wear, or bottlenecks.
- Output per shift: Shows the real productive capacity of each asset.
- Queue and buffer levels: Highlight blocked and starved conditions.
When these values shift, you know exactly where the flow starts to slow down.
Which technical considerations matter when selecting a machine monitoring platform?
A machine monitoring platform must handle industrial loads, integrate with heterogeneous OT systems, and maintain stable data flow across edge and cloud environments.
Scalability for growing machine fleets
Production volumes shift, new assets come online, and deployments extend across additional lines or sites. A suitable platform distributes MQTT load efficiently, accepts thousands of concurrent clients, and expands topic structures without restructuring the architecture.
High availability for uninterrupted data flow
Monitoring loses value when signals fail to reach downstream systems. A robust platform supports redundant broker nodes, balanced message routing, and smooth failover so that MQTT sessions remain active during maintenance work or network changes.
Multi-broker management for distributed operations
Many plants run several brokers across zones, buildings, or sites. Central management helps teams supervise all instances in one interface, track connection states, apply configuration changes consistently, and reduce effort during expansions or upgrades.
Integration paths that fit existing OT/IT systems
Machine monitoring must plug into SCADA, MES, ERP, data lakes, and cloud environments without custom work at every step. Because MQTT decouples producers from consumers, a strong platform supports standardized connections, predictable topic structures, and clean data handoff for analytics, dashboards, and AI workloads.
Best practices for industrial teams implementing machine monitoring
A machine monitoring rollout works best when structure, data flow, and team alignment are clear from the start. These practices keep the system stable and scalable.
How can teams introduce monitoring in manageable steps?
A staged rollout works when each step validates a specific part of the architecture. Start with one representative machine and verify the core building blocks:
- Signal integrity: Confirm that PLC tags deliver stable, noise-free values at the required sampling rate. Validate value types, unit conventions, and timestamp accuracy.
- Broker interaction: Test client behavior under restart, reconnect, and load scenarios. Check whether QoS levels behave as expected across the entire path.
- Topic model validation: Make sure the topic structure reflects the physical layout and can scale to multiple lines without duplication or ambiguity.
- Integration chain: Confirm that MES, SCADA, analytics, and time-series storage receive the same data with consistent timestamps and identifiers.
Once this foundation is proven, extend monitoring to a full line. Validate buffering at the edge, load on the broker cluster, and timing behavior across machines with different cycle characteristics. If the architecture holds under real takt conditions, scale horizontally without redesigning the data model.
How can OT and IT teams work together smoothly?
Most friction does not come from technology but from unclear responsibilities. A shared framework helps:
- Shared data catalog: OT defines which signals are technically reliable; IT defines how downstream systems consume them.
- Unified security model: Agree on certificate handling, mTLS, RBAC roles, and password policies to avoid conflicts at the OT/IT boundary.
- Joint review of topic structures: Both teams must understand the structure so no parallel models emerge.
- Clear ownership of operations: OT manages machine-side behavior and gateways; IT operates brokers, clusters, and storage.
- SLA for data availability: Align on response times and maintenance windows so monitoring stays dependable.
This creates stable cooperation instead of reactive discussions during downtime.
Strengthen machine monitoring outcomes with a reliable and scalable MQTT foundation
Machine monitoring depends on stable, timely, and consistent data across machines, lines, and systems. Cedalo provides the MQTT backbone that keeps this data flow predictable, even in demanding environments.
With a robust broker cluster, secure communication, and unified management, teams achieve faster diagnostics, clearer performance insight, and a solid path toward advanced use cases such as condition-based maintenance and digital twins.
Your advantages with Cedalo:
- Stable data flow for real-time machine monitoring, even during load spikes
- Scalable MQTT clusters for multi-line and multi-site plants
- Secure communication with mTLS, RBAC, and audit trails
- Consistent integration with SCADA, MES, ERP, cloud services, and data lakes
Build a reliable data backbone for machine monitoring
Get an MQTT platform that keeps machine data stable at scale. Cedalo supports high availability, secure communication, and clear broker management for demanding industrial environments.
Machine Monitoring - Frequently Asked Questions
How does machine monitoring support cross-plant standardization?
Machine monitoring creates consistent data structures across locations, making machine states, cycle values, and process signals comparable. This supports unified reporting, shared dashboards, and coordinated improvement programs across multiple plants.
What role does MQTT play in high-frequency machine data collection?
MQTT can efficiently handle large volumes of short machine messages, but actual network and edge load depends on message frequency, payload size, QoS settings, and client scaling. Its publish/subscribe model helps keep latency low and delivers the same signals to all subscribed analytics, MES, or cloud systems, with exact delivery times depending on network conditions and client processing.
Why is Cedalo suitable for regulated industries that use machine monitoring?
Cedalo supports mTLS, RBAC, certificate handling, and full audit trails, which helps industrial teams meet strict security and compliance requirements. Combined with MQTT QoS levels for guaranteed delivery, this provides a dependable base for monitoring where traceability, documentation, and secure data transfer matter.
How does Cedalo help teams run machine monitoring across multiple sites?
Cedalo provides central management for several MQTT brokers, keeping data flow predictable even when plants operate with different network conditions. Engineering teams gain one interface for configuration, supervision, and operational insight across locations.