Today we’re shipping Cedalo MQTT Platform 3.2. The headline change is High Performance Clustering — a new clustering engine that lets Pro Mosquitto deployments scale to millions of concurrent MQTT broker connections, designed for environments where a single broker would otherwise be the bottleneck. This release also brings real-time Broker Logs streaming inside the Platform UI, an Onboarding Wizard that gets new teams from a fresh install to a first connected broker without trial-and-error, and adds two new first-party plugins: a Databricks Bridge for streaming MQTT telemetry into Databricks lakehouses, and the Sparkplug Decode plugin for transparent Sparkplug B payload decoding at the broker.
What’s in this release
- High Performance Clustering
- Real-Time Broker Logs
- Onboarding Wizard
- Pub/Sub Rate Limiting
- Sparkplug Decode
- Databricks Bridge
High Performance Clustering
Why we built it
Teams running large-scale MQTT deployments hit a hard ceiling. A well-tuned single broker handles hundreds of thousands of concurrent clients — but industries like automotive, smart manufacturing, and connected logistics increasingly need to scale beyond what one node can deliver. Adding more brokers was possible, but it required bespoke clustering work outside the Platform: no unified view across nodes, limited tooling for managing the cluster lifecycle, and operational complexity that grew faster than the fleet. Operationally, that typically meant bespoke per-deployment clustering work.
High Performance Clustering in 3.2 removes that constraint. The clustering engine is purpose-built for Active/Active deployments where a single Pro Mosquitto broker would otherwise be the bottleneck — scaling to millions of concurrent MQTT clients and sustaining high-volume publish/subscribe workloads with thousands of producers and subscribers.
What’s new
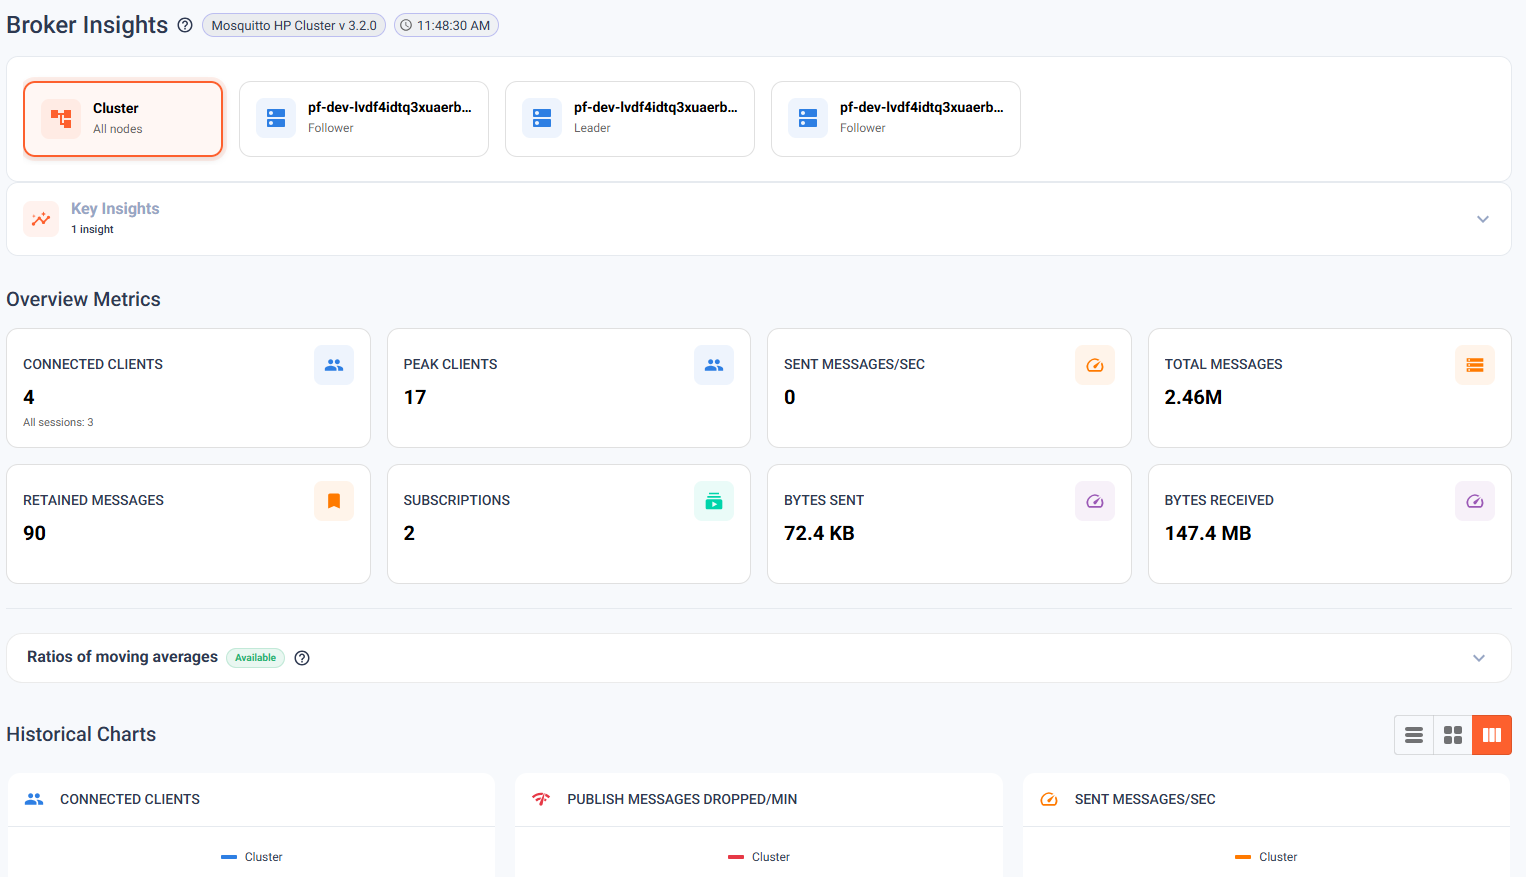
The HP Clustering engine introduces a distributed connection layer that lets multiple Pro Mosquitto nodes act as a single logical broker. Clients connect to any node; the cluster routes messages transparently. The Management Center spans the full cluster with a unified view:
- Unified cluster UI — Topic Tree, Client Inspection, Broker Logs, and Provisioning all present a multi-node view. One tab, all nodes — no more tabbing between individual broker consoles.
- Scales to millions of concurrent MQTT clients — designed for high-volume deployments with thousands of producers and subscribers operating simultaneously.
- Built for Enterprise deployments — suited for large industrial sites, connected vehicle fleets, and platform operators serving thousands of concurrent customers from a shared backbone, where a single broker is no longer sufficient.
Detailed benchmarks and methodology are available on request — reach out to your account team.
High Performance Clustering is an Enterprise-tier feature available on-premises and on Cedalo Cloud on Enterprise plans.
Read the High Performance Clustering documentation
High Availability improvements
3.2 also advances the existing High Availability cluster story. HP and HA are alternative deployment modes — most teams pick one. HP scales beyond what a single broker can handle and, with a few edge-case exceptions, covers the same fault-tolerance ground that HA covers; HA stays the focused choice when capacity is fine but resilience is the priority. New in this release:
- UI-based leader assignment — promote a node to cluster leader directly from the Management Center without touching configuration files.
- Improved unreachable-node resilience — the cluster degrades more gracefully when a node is temporarily offline, reducing split-brain exposure.
- Deadlock and state-sync fixes — edge cases that could affect long-running clusters under sustained load are resolved.
Cluster monitoring
3.2 also extends the broker-side metrics surface with cluster-aware counters and gauges. Operators can now observe per-node throughput, cross-node routing volume, and cluster-membership health from the same metrics endpoint as the rest of the broker telemetry — wired into existing Prometheus / Grafana dashboards without additional collectors.
Read the cluster monitoring documentation
Migrating from 3.1.x
For non-clustered installations, a standard package upgrade from any 3.1.x version is sufficient. For existing HA clusters, ensure all nodes are on 3.1.9 before migrating — older 3.1.x versions cannot be upgraded directly to 3.2 in clustered mode. See the 3.1 release notes for context on what changed in the 3.1.x series. Review the full migration documentation before starting.
Real-Time Broker Logs
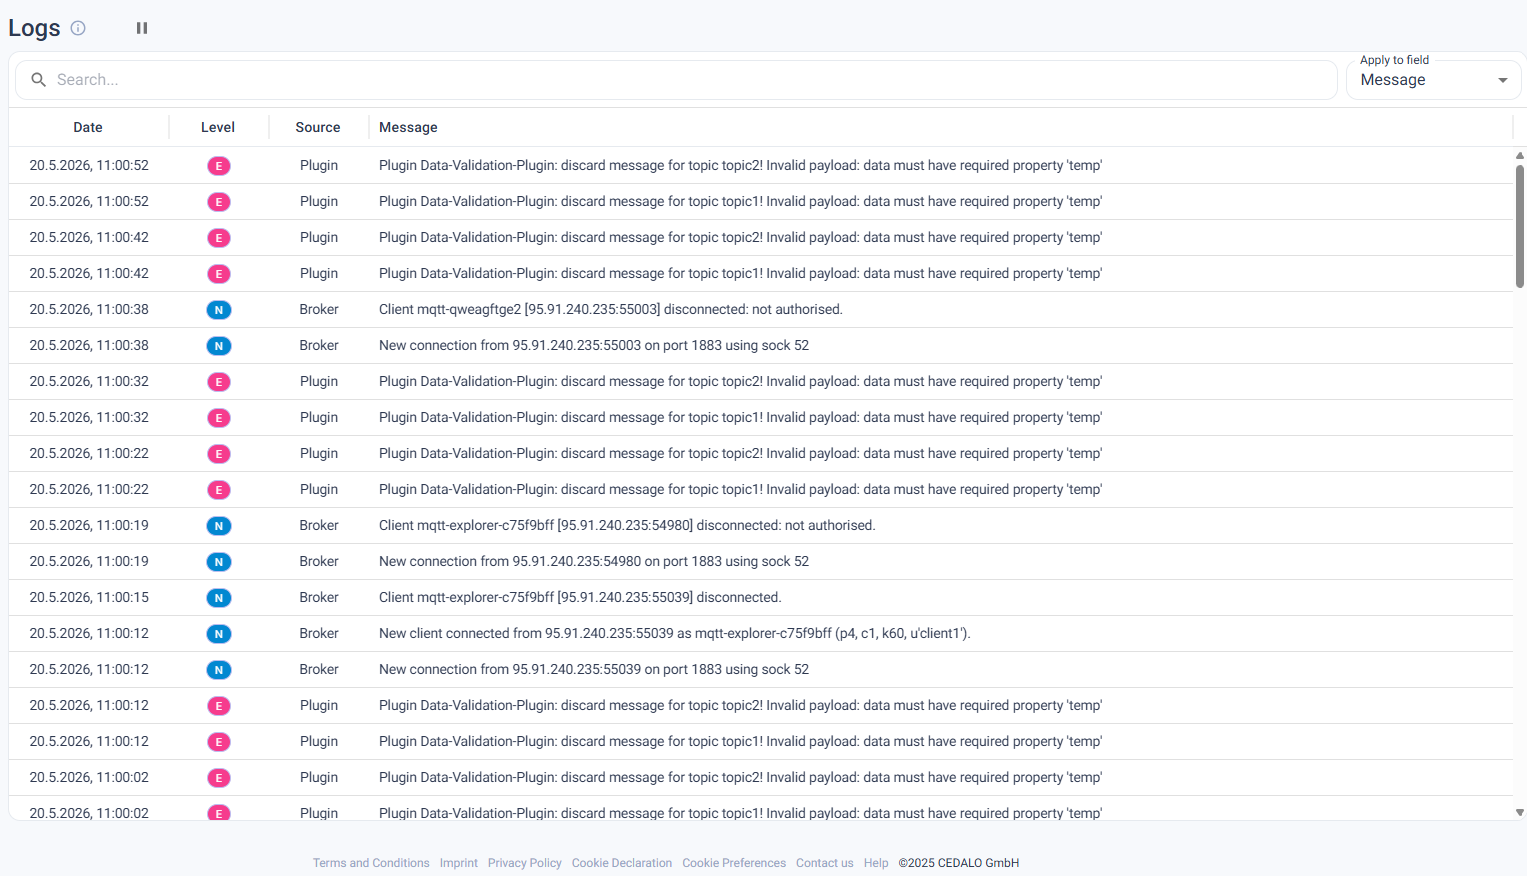
Until now, debugging a misbehaving broker meant SSHing into the host and tailing logs — or opening several terminal windows and reconciling timestamps across nodes. For on-call engineers without direct server access, that was often a blocker before it was a workflow.
Broker Logs streams output from your brokers directly inside the Platform UI. Filter by severity level, plugin, or bridge. In clustered deployments, a combined view aggregates output across all nodes into a single time-ordered stream. Log entries update in real time without a page refresh, and anyone with the appropriate Platform role can access them — no server credentials required.
Read the Broker Logs documentation
Onboarding Wizard
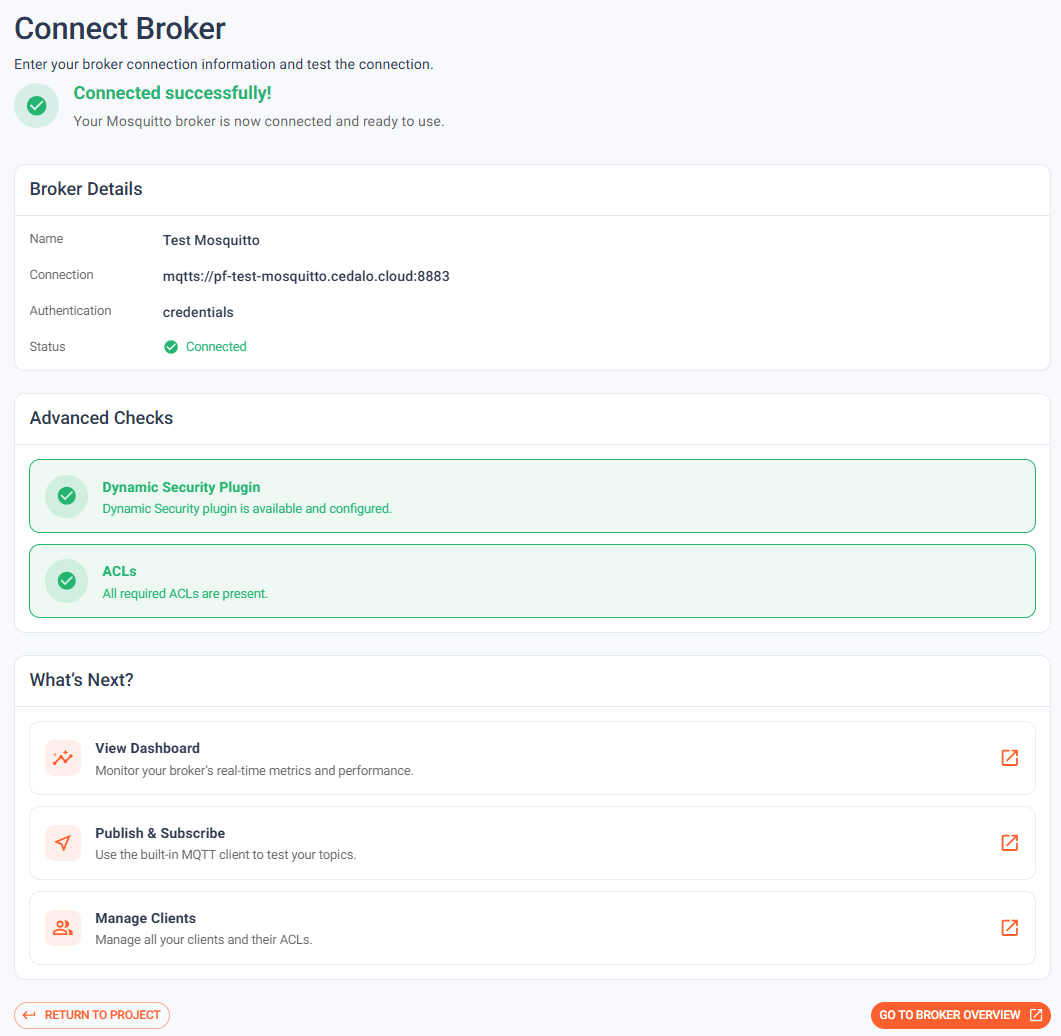
New users were dropping off at the connect step. The flow had too many implicit assumptions — which port, which protocol, where credentials live — and errors only surfaced after a failed save. The Onboarding Wizard fixes that feedback loop.
The wizard guides users through each step of connecting a broker to the Platform and actively verifies that credentials and endpoint reachability check out before completing setup. Misconfiguration errors surface inline before the wizard finishes, not after a restart or a failed connection attempt. The result: teams get from a fresh Platform install to a first connected broker without trial-and-error, and without a checklist of implicit prerequisites to memorize.
Read the Onboarding Wizard documentation
Pub/Sub Rate Limiting
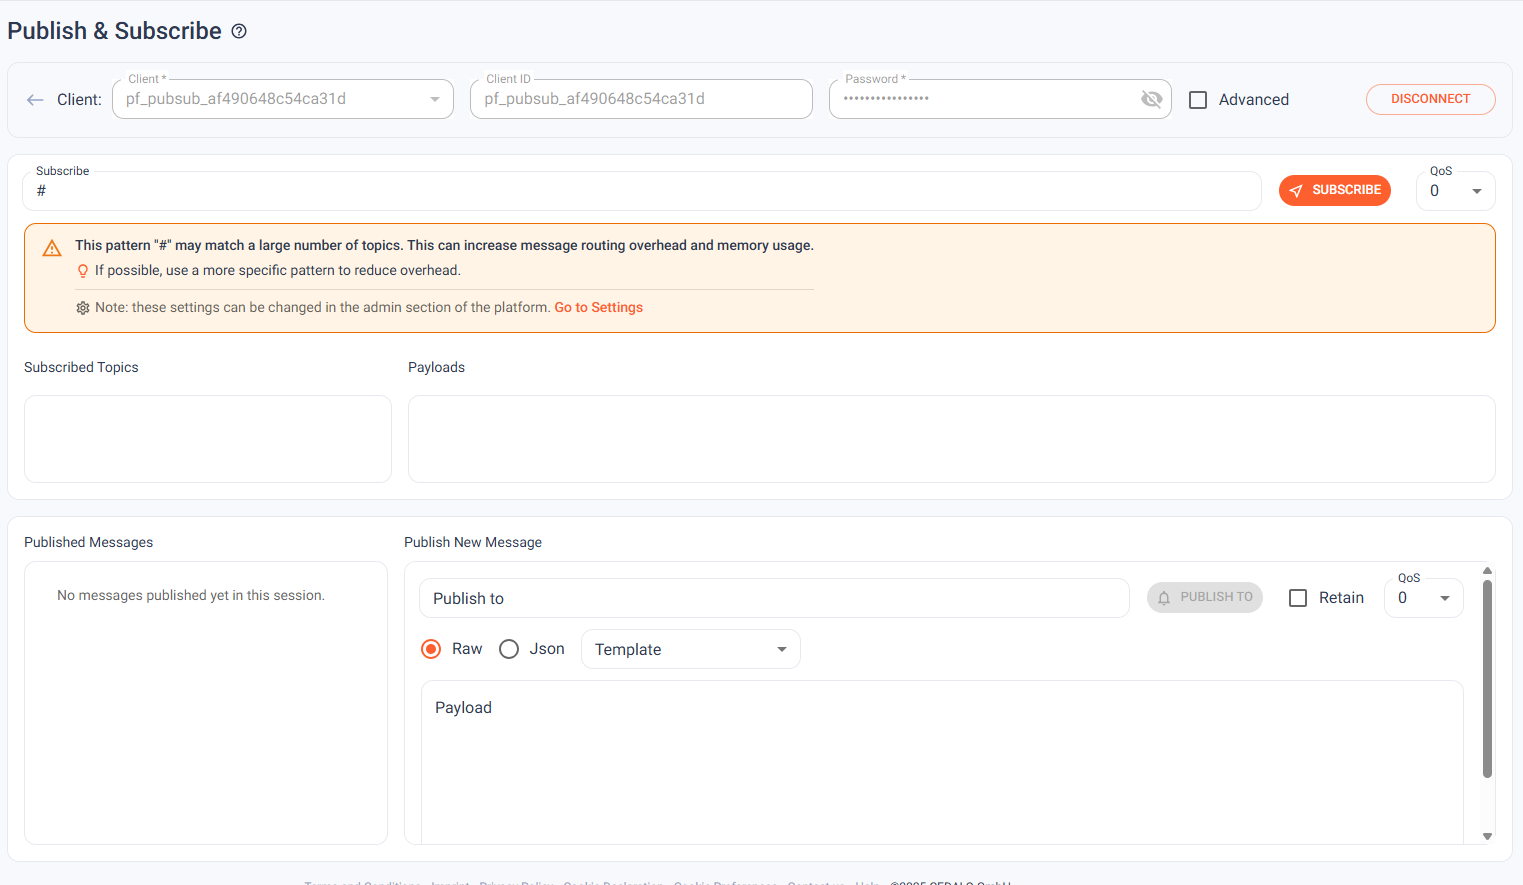
Subscribing to # on a busy broker can saturate a network link in seconds. The subscriber sends one SUBSCRIBE packet; every message on every topic flows back. On a high-load production broker, a single accidental root-wildcard subscription can cascade into an incident.
3.2 adds subscribe-time rate estimation. When a client attempts a broad wildcard subscription — particularly root wildcards like # — the Platform surfaces a visible warning showing the estimated message rate before the subscription is committed. Operators and developers catch the mistake before it becomes an outage.
- Rate estimation runs at subscription time, before the subscription is committed.
- Root-wildcard subscriptions (
#) trigger an explicit warning in the Management Center. - Configurable threshold — teams can set the message rate at which warnings activate.
Read the rate limiting documentation
Sparkplug Decode
The Sparkplug Decode plugin ships in 3.2 as a new first-party capability for customers running Sparkplug B deployments in IIoT and Industry 4.0 environments.
The plugin decodes Protobuf-encoded Sparkplug B payloads to JSON at the broker layer, eliminating the need for a separate decoding service between the broker and your analytics stack. It also performs per-metric topic explosion — individual metrics within a Sparkplug message are published to their own derived topics, making them addressable by standard MQTT clients without Sparkplug-specific tooling.
- Protobuf → JSON decoding handled at the broker, not the application layer.
- Per-metric topic explosion: each metric gets its own addressable MQTT topic.
- Runtime control via
$CONTROL/cedalo/sparkplug-decode/v1.
Read the Sparkplug Decode documentation
Databricks Bridge
The Databricks Bridge ships in 3.2 as a new first-party integration. Data teams streaming MQTT telemetry to Databricks lakehouses can now configure a bridge maintained by the Mosquitto core team, with a production-quality maintenance commitment from day one.
The bridge provides declarative topic-to-table mappings — define which MQTT topics write to which Databricks tables, configure batching for throughput efficiency, and control the bridge at runtime via the MQTT Control API. Authentication supports both PAT tokens and OAuth M2M flows, covering the range of Databricks workspace configurations teams typically encounter in production.
- Declarative MQTT-to-Databricks topic-to-table configuration.
- Configurable batching for high-throughput streaming to lakehouses.
- PAT and OAuth M2M authentication support.
- Runtime reconfiguration via
$CONTROL/cedalo/databricks-bridge/v1.
Read the Databricks Bridge documentation